Motivation
Since diffusion is inefficient for transport over “large” distances (more than a few tens or hundreds of microns, say) many biological systems create a nonzero average velocity (a drift velocity) to move objects over “large” distances. Of course, on the microscopic scale Brownian motion is still occurring on top of this transport process. In this lab you will create both phenomena simultaneously and try to identify their separate effects in your analysis.
Materials and Process
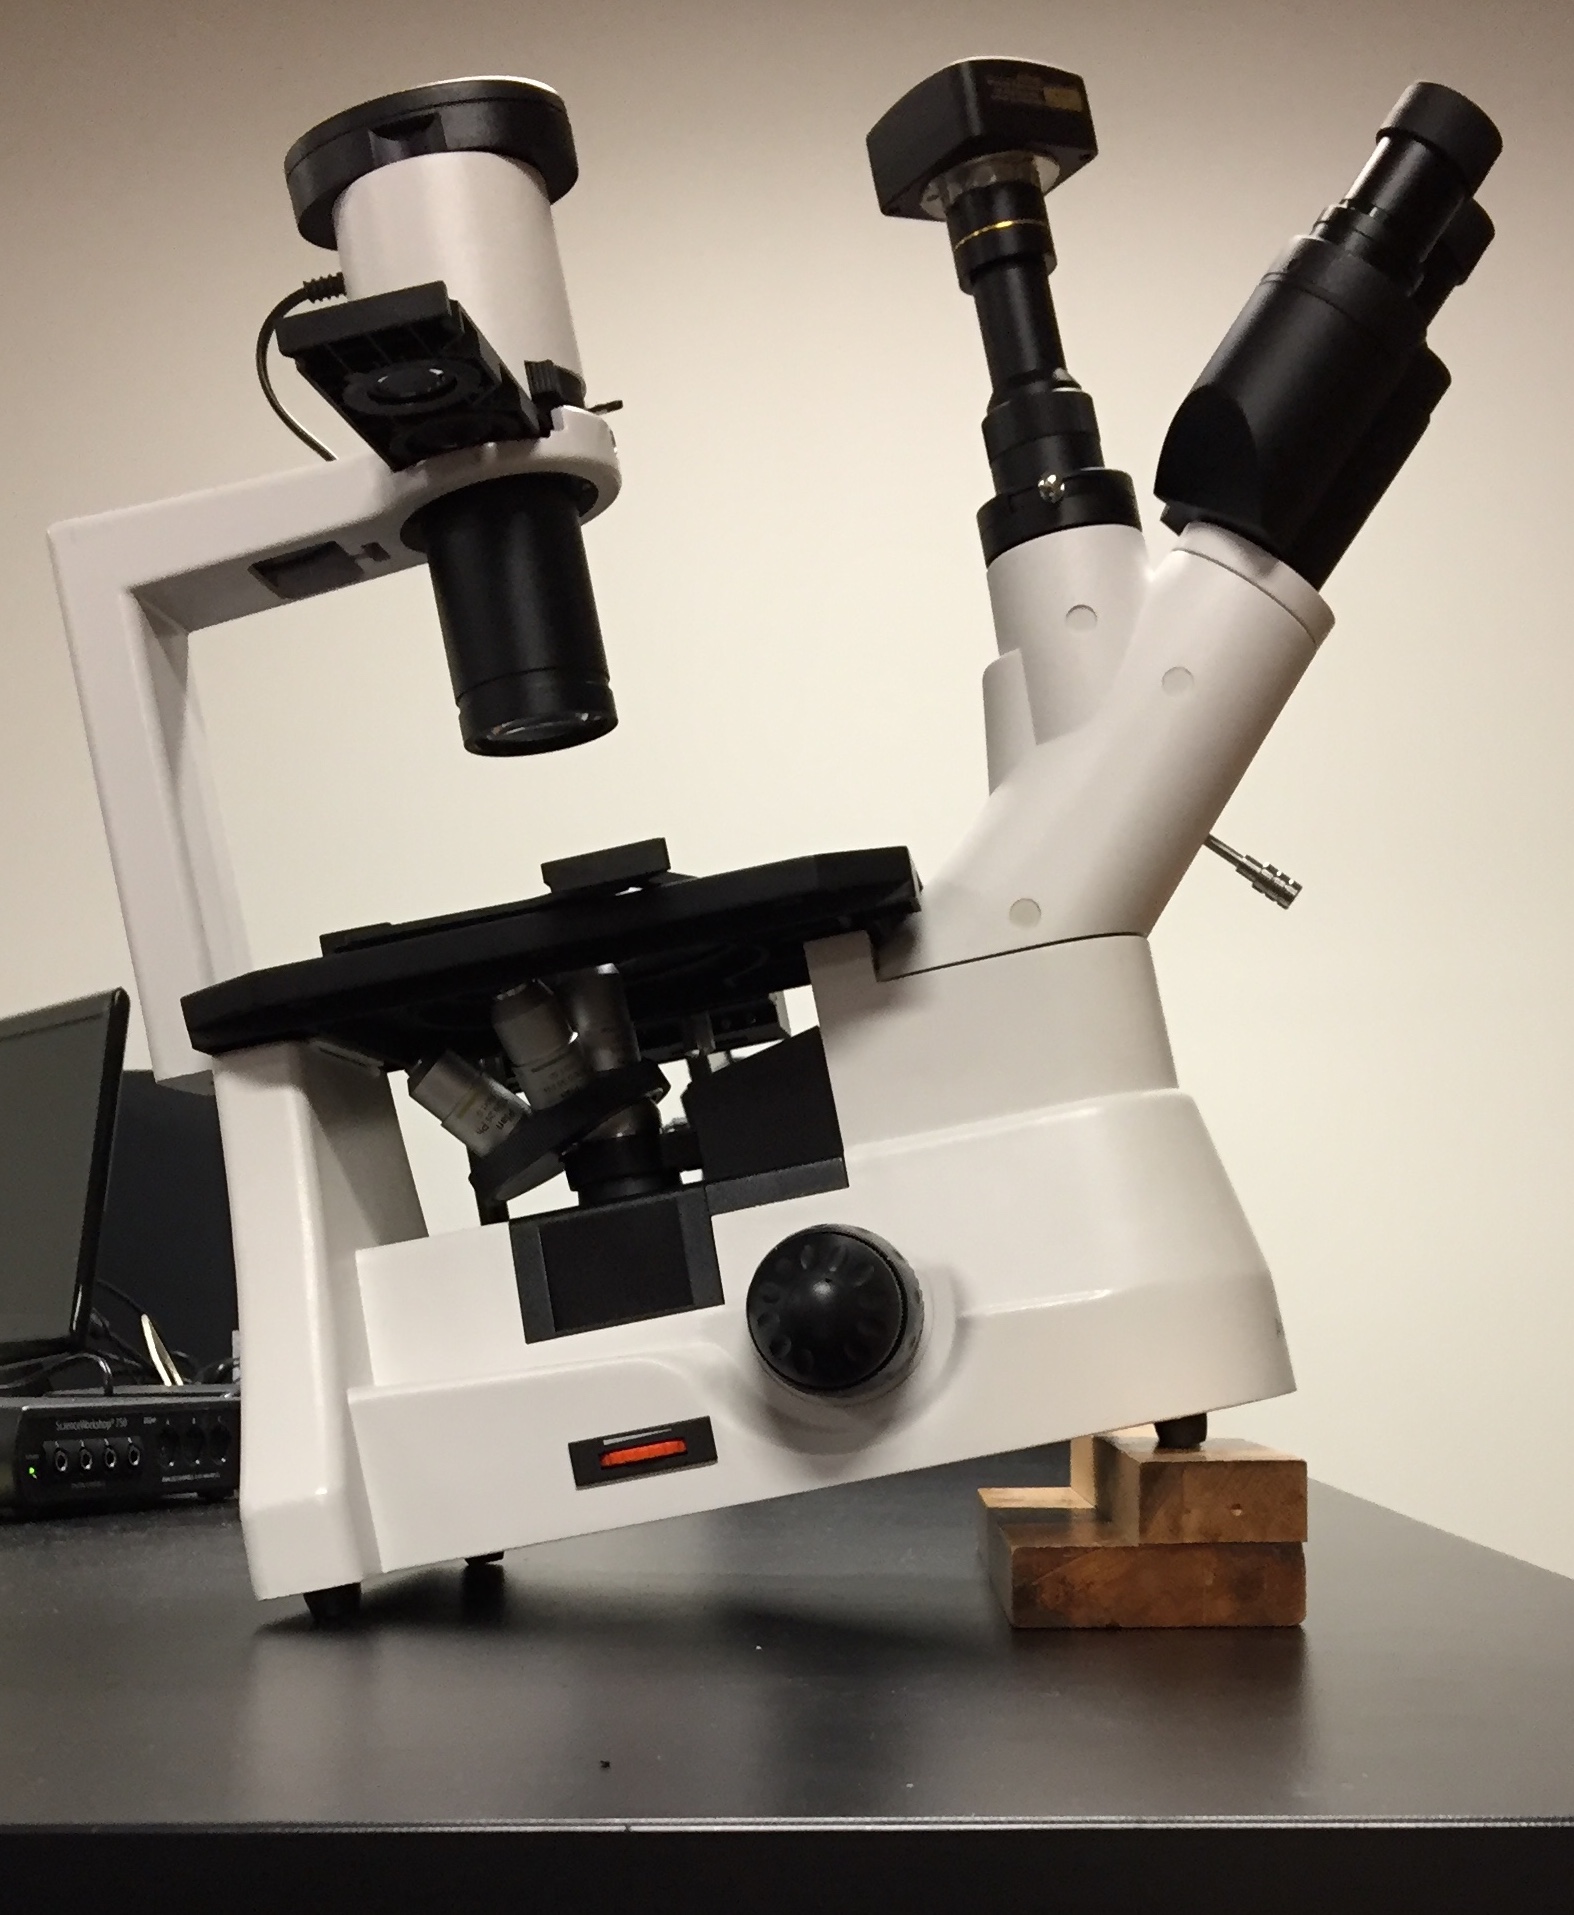 Tilt microscope using the wooden block. Take a picture of it: you will use this to calculate the tilt angle of the sample slide. Make sure your camera is aligned with the microscope body (not skew).
- Take time-lapse data of 2 um glass beads using AmScope:
- Use the maximum camera resolution (highest pixel number).
- Use Capture > Start Time-lapse (Auto Capture)
- Set the time delay (strangely known as “Time Slot”) to a few seconds
- Take 200 photos. This will take several minutes.
- Take a new spatial calibration snap.
- Tracking using Fiji:
- Use Import > Image Sequence to load your images.
- Convert to 8-bit image using Image > Type
- Optional / if necessary; I had trouble with dirty background / small beads so I ran some post-processing to clean up the video:
- If the illumination is not uniform (thresholding levels are different in different corners of the image), smooth the images using Process > FFT > Bandpass Filter
- Set the upper and lower sizes to about 1/3 of the bead width (in pixels) and 3x the bead width. This calculation can take a while.
- Subtract off the background:
- Average all the images together using Image > Stacks > Z Project, selecting the average image intensity.
- Subtract the average from each image in the stack using Process > Image Calculator. Set the result to be 32-bit, but then immediately convert it to 8-bit to save memory.
- If the illumination is not uniform (thresholding levels are different in different corners of the image), smooth the images using Process > FFT > Bandpass Filter
- Threshold the stack and then use the MTrack2 tracking program as before.
- You may need to increase the Maximum velocity parameter since the beads may move more than the default 2 pixels between pictures. Depending on the time lapse between images, you may need to increase this to 30 or 40 or more; if you don’t want to guess, zoom in on a region and follow a bead by eye from frame to frame, then set the velocity parameter to be somewhat larger than the largest frame-to-frame movement that you observed.
Writeup
Please use this blank template as a starting point for your writeup.
Plot <x>, <y>, <x2> and <y2> to look for evidence of drift. Drift (constant velocity motion) will show up as linearly increasing <x> (or <y>) AND quadratically increasing <x2> (or <y2>)
Questions to be answered
- What is the tilt of the microscope (in degrees)? Show how you calculated this.
- Explain what you would look for in your plots to show evidence of drift, and why.
- From you plots, do you see evidence of drift in x or y?
- From the bead size and the tilt of the microscope and the viscosity of water, calculate the expected drift speed of the beads. Is your result (or lack or result) reasonable?