
Motivation
In this lab we will be analyzing video data gathered previously, using the microscopes, for fluid flow in two different microfluidic devices. These microfluidic devices serve as excellent models for fluid flow in biological systems. By analyzing flow videos in ImageJ, we can explore the effect of device geometry on the velocity, v, of the beads in the fluid. The beads serve as tracers and tell us how fast the fluid itself is moving.
You will be quantitatively analyzing four videos total: two videos taken from each of two devices (see diagram below)
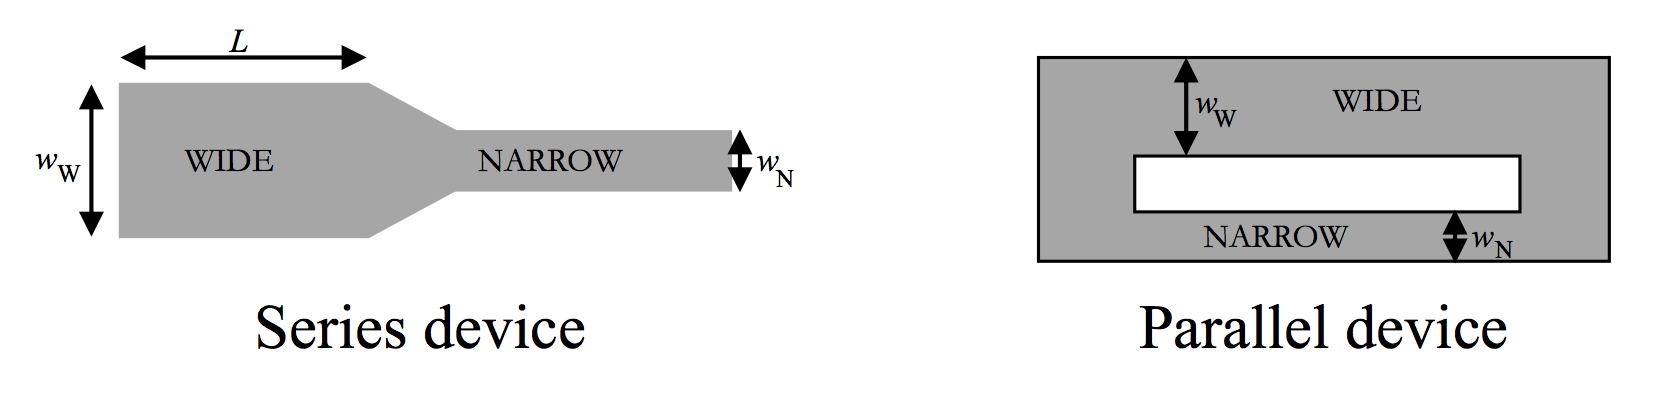 Each devices consists of two channels connected to each other. In the series device the wide and narrow channels are connected in sequence. In the parallel device, the wide and narrow channels are next to each other, but both fed from the same inlet and outlet. In these devices, the width w of the wide channel (6.0 mm) is twice the width of the narrow channel (3.0 mm), and the lengths L = 2 cm and depths h = 20 μm (depth is not shown in the top view) of the wide and narrow channels on each slide are equivalent. The magnification of the videos is 2.6 pixels/μm. To drive the fluid through the devices, the video makers used a plunger syringe and applied a force to the plunger that was as steady and repeatable as possible.
As the fluid (containing 5-μm beads) flows from the left side to the right side of the microfluidic devices, the volumetric flow rate of the fluid (Q, in m3/s), and the pressure drop (ΔP, in Pa) will be related by the Hagen-Poiseulle equation.
For a circular cross section (of radius R), we saw last semester that $$Q = \pi R^2 v$$ and $$\Delta P = \frac{8 \mu L Q}{\pi R^4}.$$
For a shallow rectangular pipe (as we have here), the HP equation gives a slightly different relationship between Q and ΔP: $$Q = w h v $$ and $$\Delta P = \frac{12 \mu L Q}{w h^3},$$
where L is the length of the channel, μ is the viscosity of the fluid, A is the cross-sectional area of the channel, v is the average speed of the fluid, and ΔP is the pressure drop between the ends of the channel.
Depending on whether the channels are hooked up in series or in parallel, we expect them to have either the same flow rate Q or the same pressure drop ΔP. Your job is to determine which channel geometry (series / parallel) produces which conserved quantities (same Q / same ΔP) and explain why this is so.
Materials and Methods
Grab copies of the video files below:
- Load the files into Fiji (aka ImageJ)
- Calculate the average flow speed v in each geometry by measuring the motion of a half-dozen beads in each video. Frame-by-frame tracking is overkill: you can skip multiple frames so that the bead moves across the full visible video area. Measure the speed of 5 beads and report the average in your writeup.
- Calculate the flow rate Q and the pressure drop ΔP for each channel. You will need a value for the viscosity of water: 0.001 Pa.s
Writeup
Use this blank template for your writeup.
Questions to be answered
- What is the flow speed in each channel, in m/s?
- What is the volumetric flow rate in each channel, in m3/s?
- What is the pressure drop in each channel, in Pa?
- When channels are connected in series, do they have the same flow rate or the same pressure drop? Why?
- When channels are connected in parallel, do they have the same flow rate or the same pressure drop? Why?