Motivation
The biophysical motivation for this laboratory is the ubiquity of charges in living systems. Large molecules — in particular, proteins — are often phosphorylated and thus carry net charge. These charges generate electric fields, exerting attractive forces on other molecules and playing a role in the intricate balance of forces and movements that occur in a living cell! We might ask: how far is the reach of the force field from a charge in a large protein when many ions are present in the surroundingfluid? How fast would a charged protein move in an electric field? These effects are crucial for understanding biological systems at the cellular level.
In this lab, we will investigate related questions in a simple model system. You will be investigating charge screening in fluids by employing the technique of electrophoresis. You will look at the behavior of glass beads in de-ionized water (DI water – aka pure H2O), and salt water.
We have been employing solutions of glass beads in water in most of our labs. You may have noticed that some of the beads are stuck together, forming clumps (also called ‘flocs’ because their aggregation (coming together) is a form of flocculation), or that the beads sometimes “settle out” of the fluid. Aggregation (flocculation or coagulation) and sedimentation are behaviors common to colloidal fluids. A colloidal system is one in which one phase of matter is finely dispersed throughout another phase of mater. Our glass beads in water are colloidal fluids because the glass beads (solids) are small particles dispersed throughout the water (fluid). In fact, when the glass beads are submerged in water, they become charged — even in DI water! The glass beads, SiO2, have surface groups of SiOH. When immersed in water, the hydrogen nucleus breaks free (increasing the acidity of the fluid due to the roaming H+) and leaving an SiO– behind. Thus the surface of the glass beads becomes negatively charged: each bead carries charge on the order of a few femto-Coulombs (fC). [You might then ask, if all the beads are negatively charged, then why do they stick together? Besides the electric repulsive forces between the beads, there are also attractive van der Waals forces; at close enough distances, the attraction dominates the interaction and the beads will stick together to form a floc.]
If a salt (such as NaCl) is added to the fluid, it will dissolve and the free cations (or anions, for a positively charged colloid) will group around the negatively charged beads of glass, thus decreasing the ‘effective charge’ of the bead: this is called ‘charge screening’ or ‘Debye screening.’ The more ions that are available in the fluid, the greater the charge screening effect will be; thus the concentration of the electrolyte is important.
Materials and Methods
To investigate this charge screening effect, we will need to determine how charged our glass beads are in DI water and then compare that charge to the ‘effective charge’ as seen in various concentrations of saline solution.
We can measure these charges using the technique of electrophoresis. By applying an electric field (generated by a potential difference between two electrodes) to the fluid (see picture above right), we can cause an electric force on the charged beads that will induce motion through the still fluid. A larger electric field will cause faster motion, as will a larger effective charge on the bead. NB: the effective charge on the bead is the screened charge (see the reading), not the surface charge. The actual surface charge of the bead is fixed (for a given pH, anyway): if the effective charge changes with [NaCl], this is a direct consequence of charge screening. The effective surface charge is generally interpreted to be the screened charge at the outside of the Stern layer (see the reading).
You will record bead motion in chambers of an 8-well microscope slide mounted on a microscope.
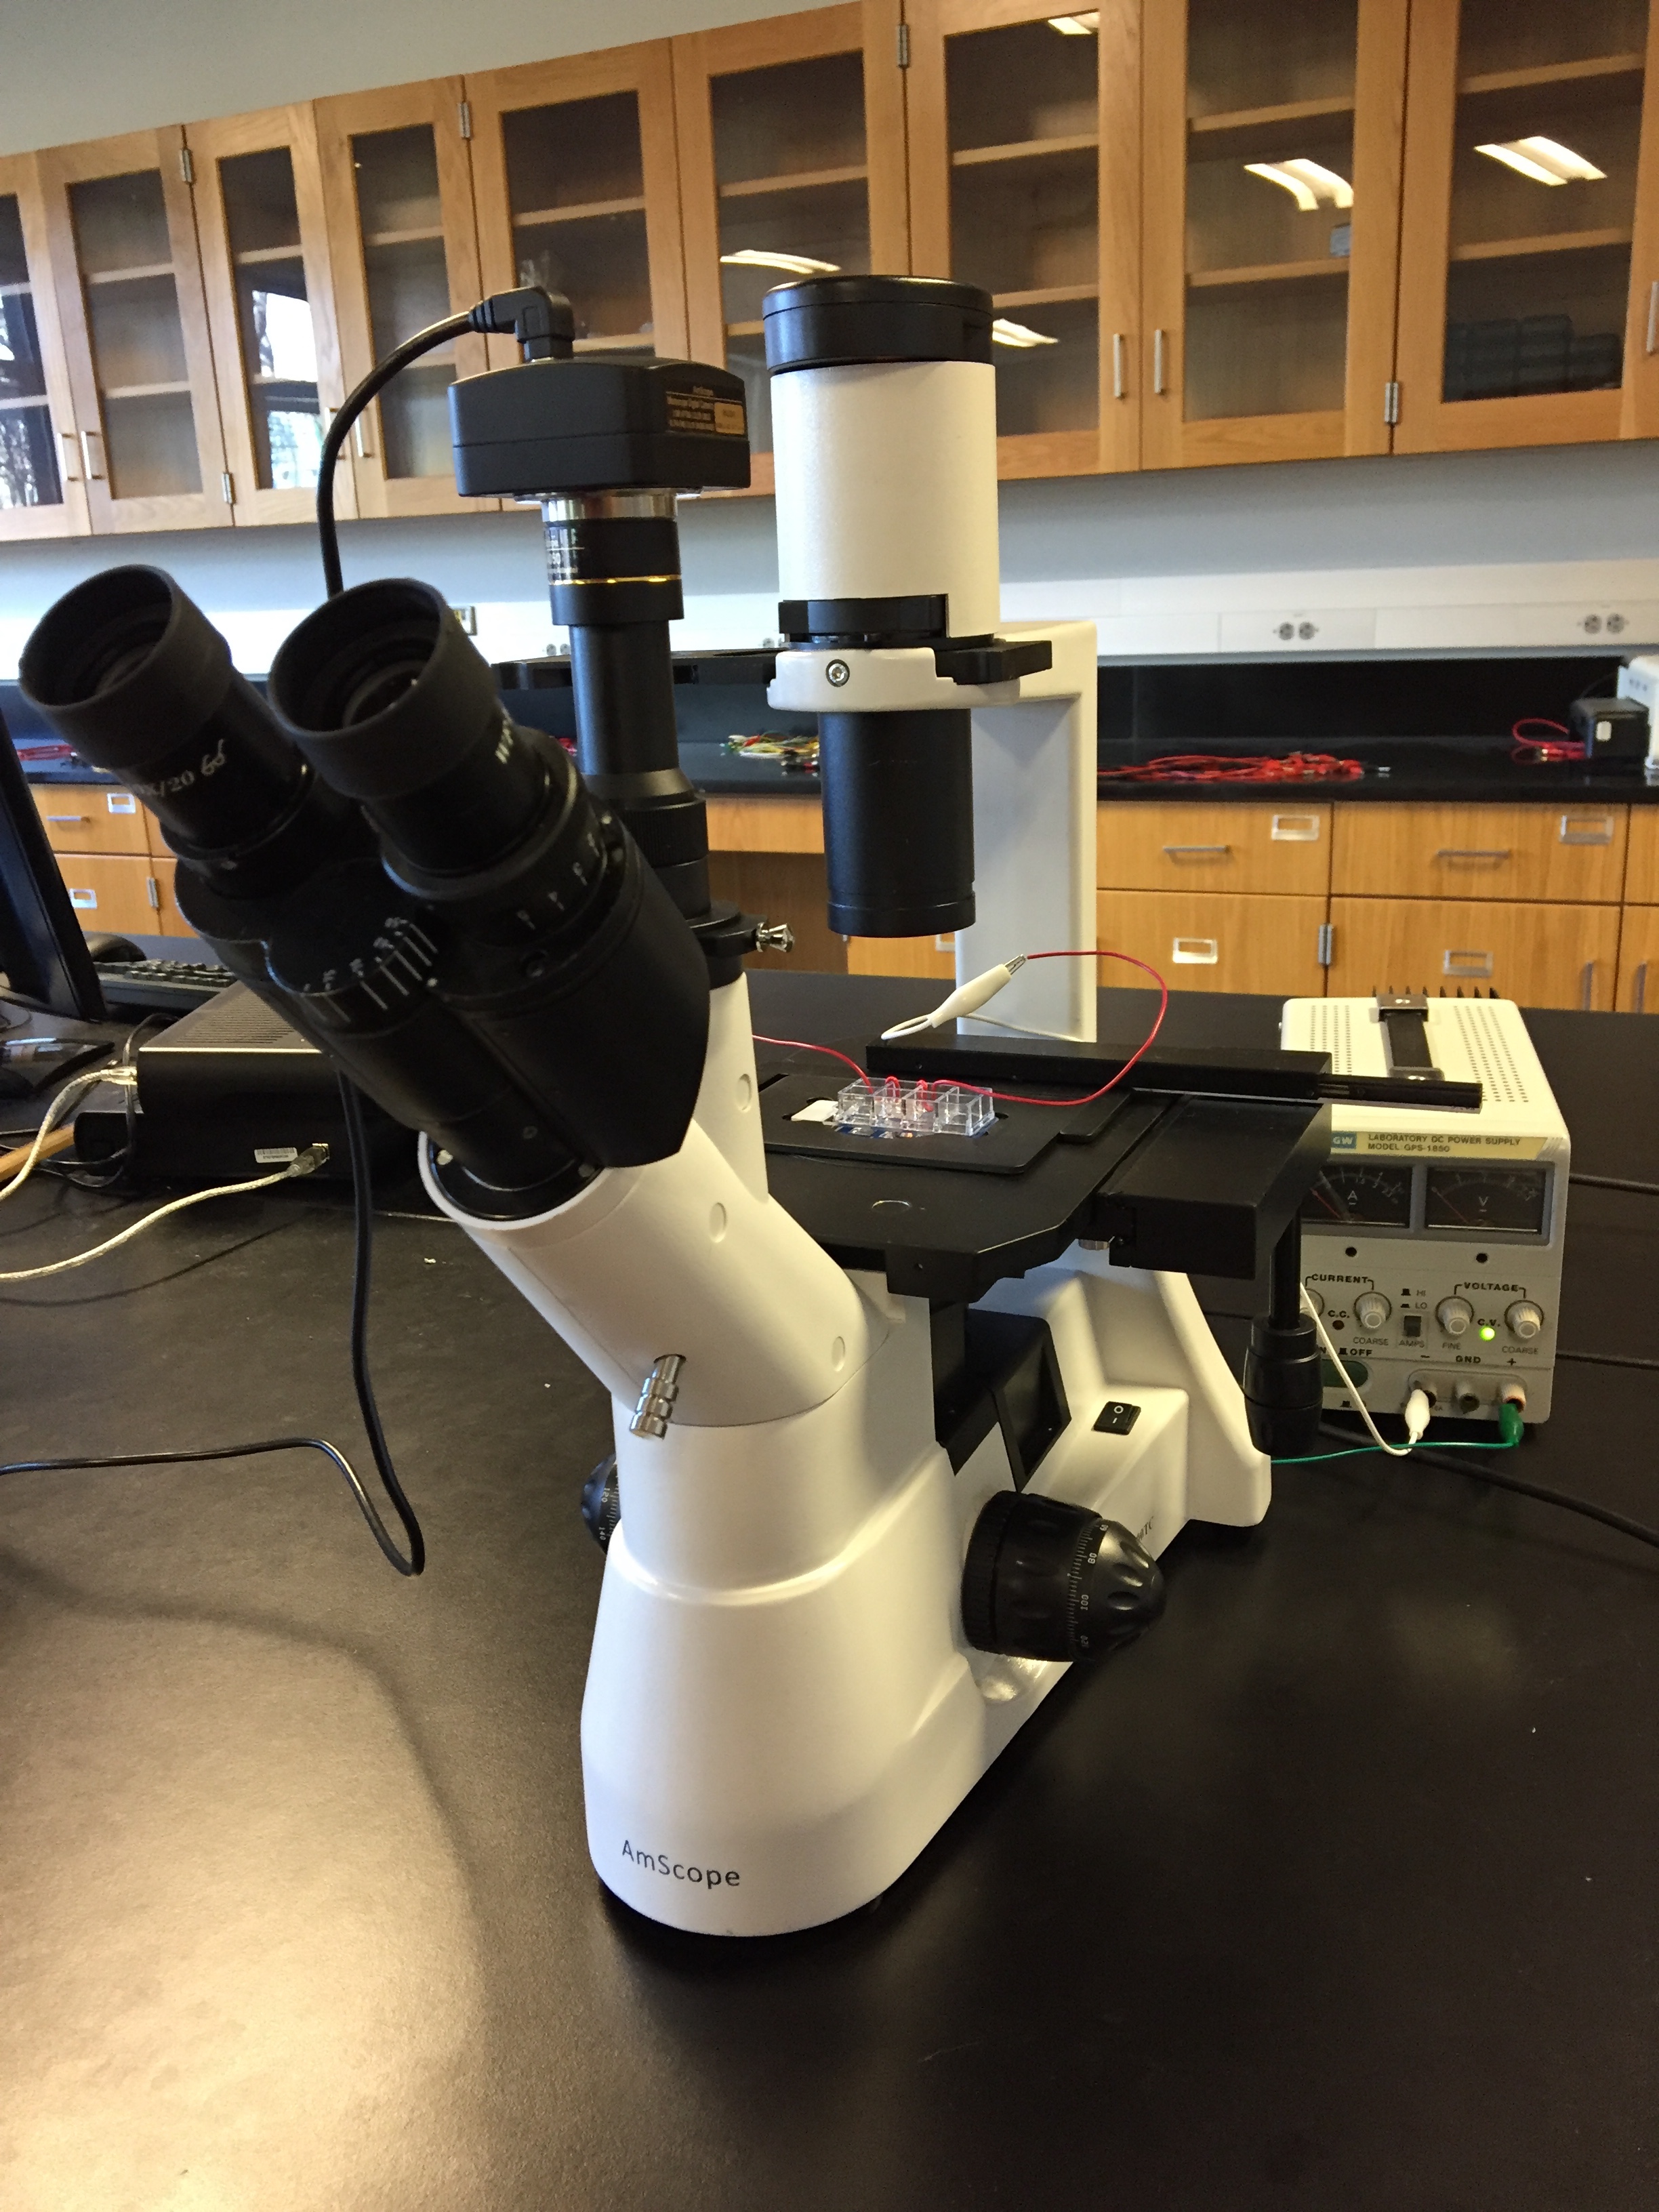
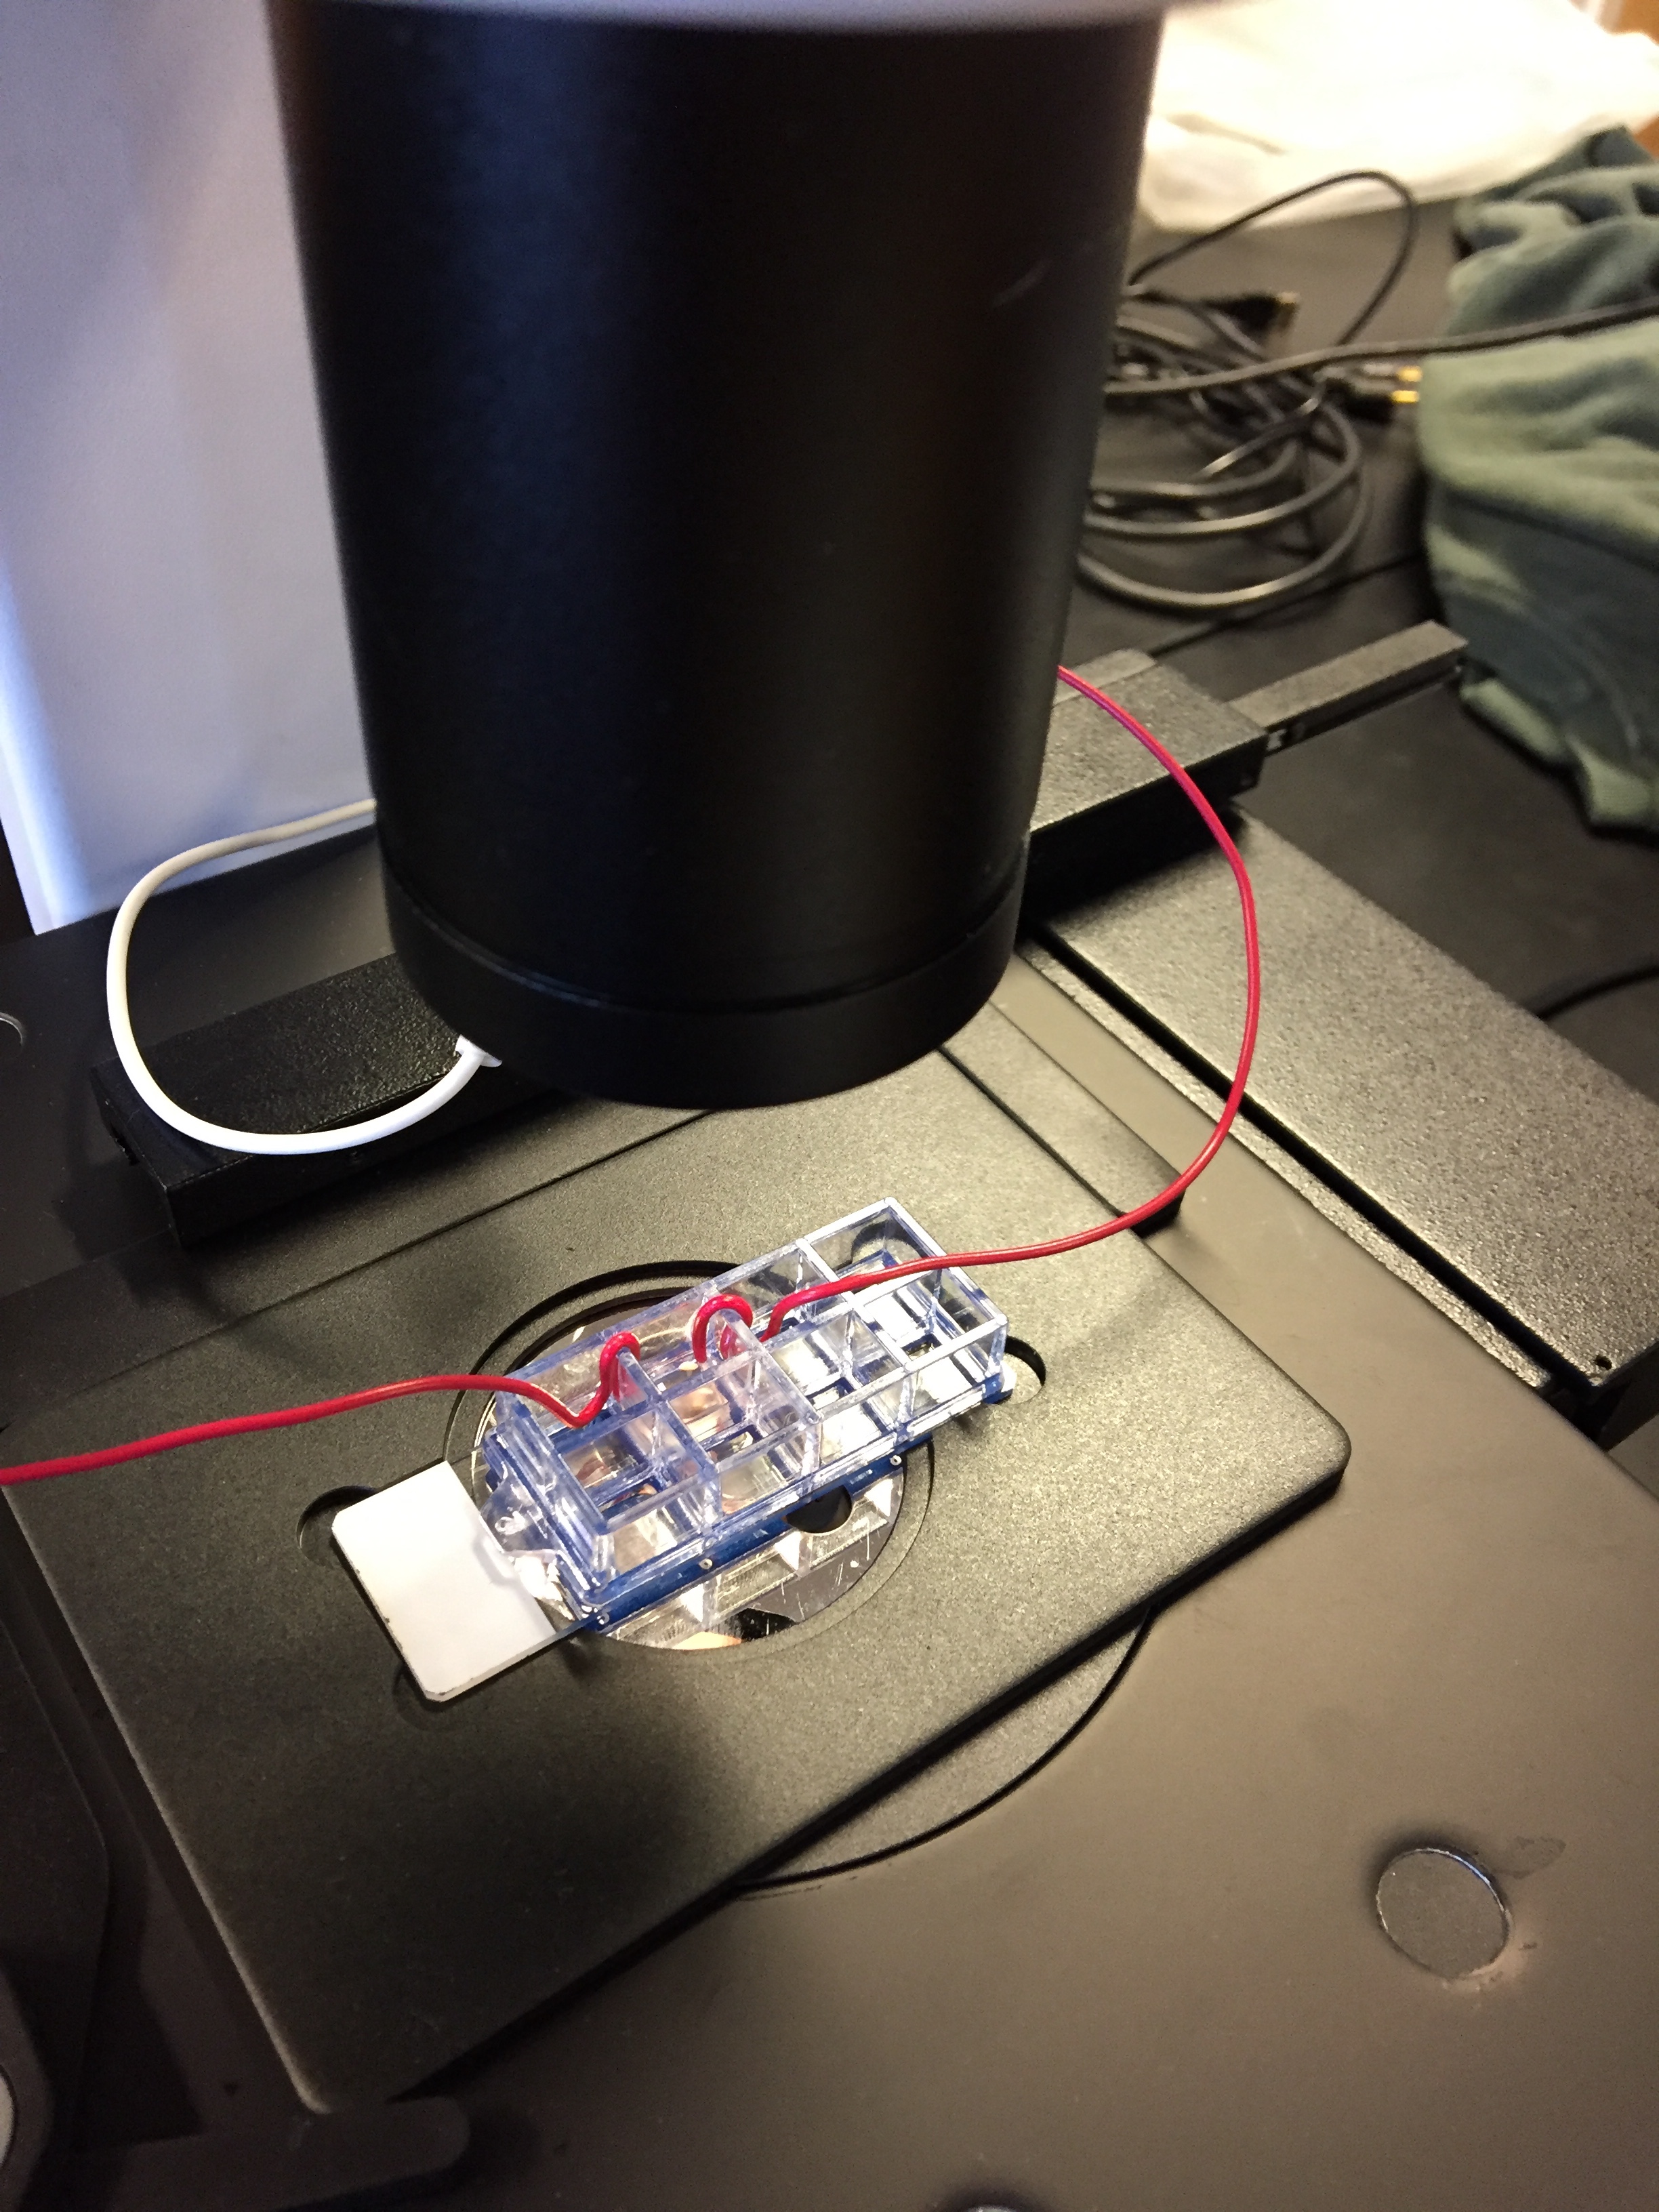
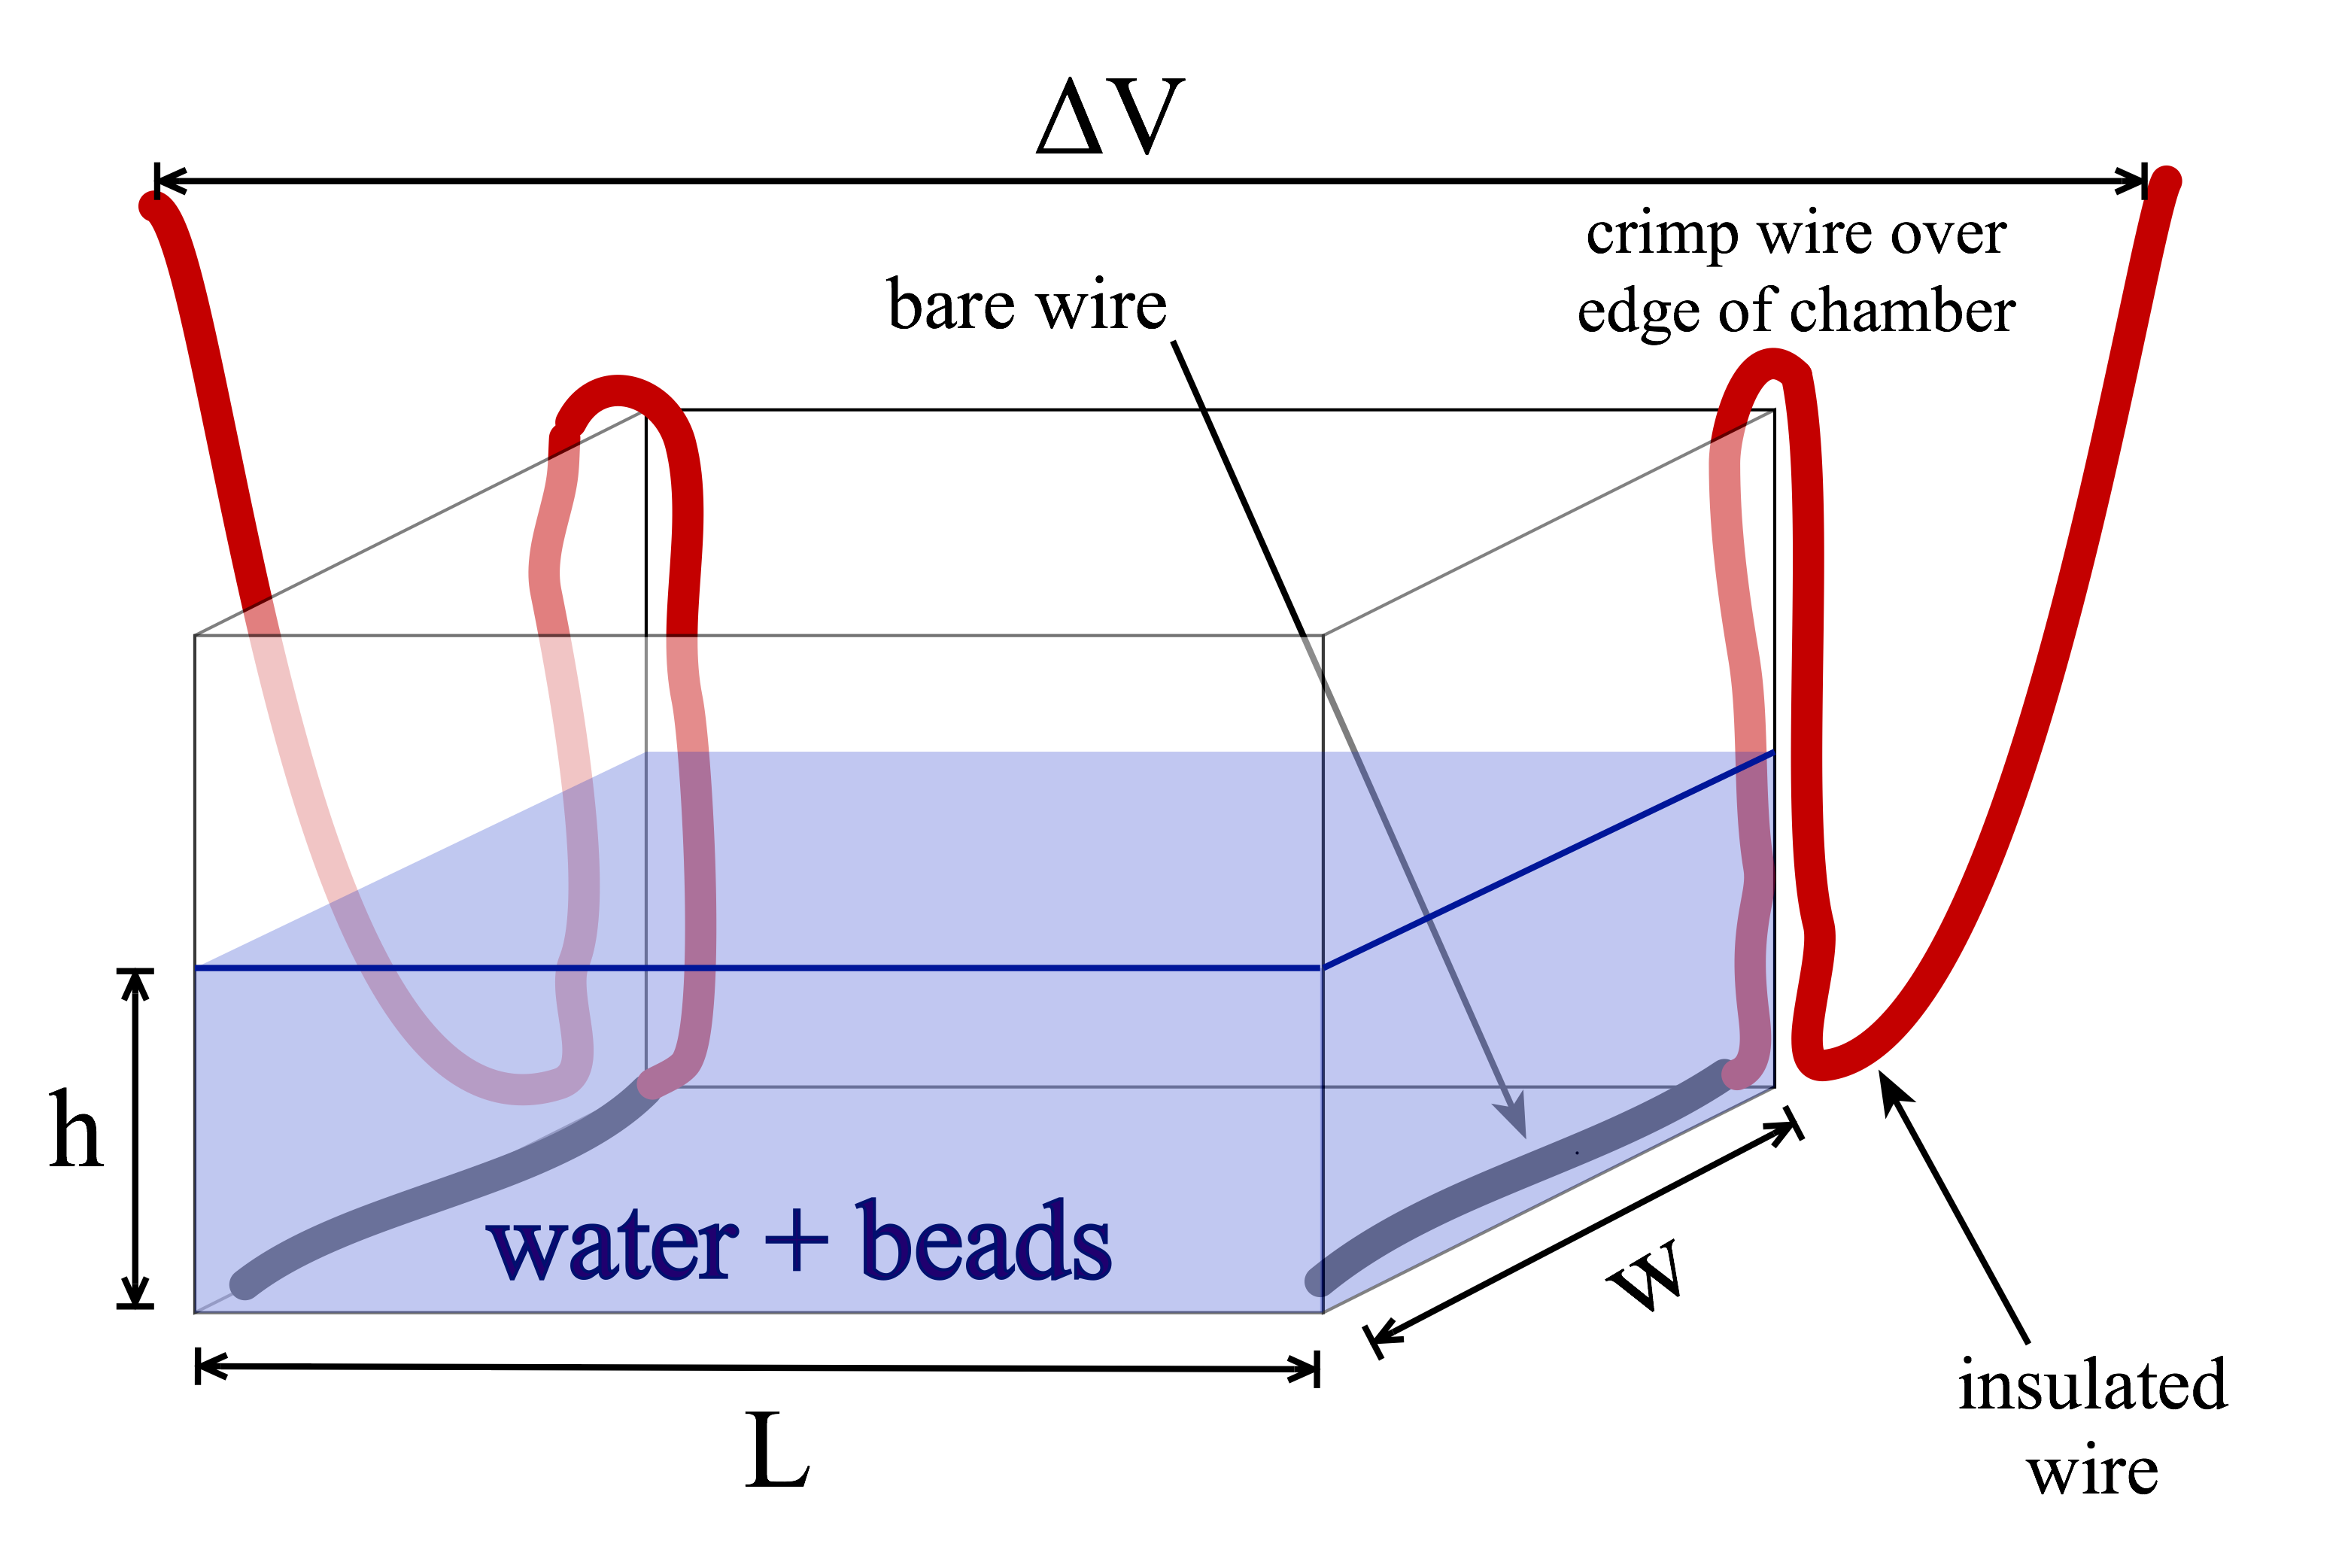
The electric field is supplied by a variable power source connected to two bare wires that are inserted at either end of the well. Since the setup is hard to see in the pictures above, I have attempted to draw a diagram of it:
Practical details and hints:
- All solutions contain glass beads that are 2 μm in diameter.
- For each solution, record bead motion for five voltages between 0 and 10 volts. These can done be in one big video (faster to record but risks confusion) or in separate files (more fiddly to record, but easier to keep track of if your record-keeping is good).
- Use 40x mag and look at beads just above the surface.
- Make your recording as quickly as possible and then immediately turn off the voltage and check that with no voltage there is no bead motion.
- If you are seeing bulk flow (beads moving even with no voltage applied) you may have bubbles or uneven heating:
- Look at beads just slightly above the bottom surface. Bulk flow is less likely near a surface.
- Try to avoid heating up your sample: gather your video data as soon after applying the potential difference to the electrodes as possible, and place the fluid sample on the microscope stage (above the hot bulb) for as short a time as possible before gathering your video.
- Mix the fluid chamber to even out temperature gradients and remove bubbles: suck out the fluid with the eyedropper and reinject it into the chamber.
- If you are seeing bulk flow (beads moving even with no voltage applied) you may have bubbles or uneven heating:
- You do not need to use particle tracking (manual or automated) for these videos, but you do need a reasonable amount of data. Not all the beads move at the same speed, so you will need to average over 10 beads to get a reliable measure of speed. You will report the average speed (vavg) and the error on that average (Δv, the standard deviation)
- The saline solution is 200 mg/L NaCl. The viscosities of this solution is almost identical to that of pure DI water: 9.0×10⁻⁴ Pa-s at 26 °C.
Writeup
Use this blank template for your writeup.
To calculate the charge on the bead,
- Plot the bead’s average speed (v) versus the applied voltage (ΔV) for your 5 values of voltage.
- Get the slope m of the v vs ΔV line, with the intercept fixed at zero. One possible way to do this is using the trend line tool in Excel.
- Calculate the charge q from your value of the slope.
- Repeat the procedure for each of your sets of data: once with DI water, and once with salt water.
Questions to be answered
- At the top speed that you observed during your experiment, use the Stokes (viscous) drag formula to calculate the force (in pN) that was required to move the beads through the water?
- Recreate the steps you went through to solve the lab pre-work, and derive an equation relating the applied voltage (ΔV) and the measured bead speed (v). In addition to constants and geometric factors (such as bead size) and material properties (such as fluid viscosity), your equation will contain the charge of the bead. This is what we are trying to measure!
- What is the surface charge of the bead in DI water? In salt water? How do these compare?
- Estimate how many of the surface SiOH groups on the bead are charged in DI water. What fraction of the total number of SiOH groups is this, if a typical SiOH group is about 3 Angstroms across?
Based on material originally by K. Moore, J. Giannini, K. Nordstrom & W. Losert (Univ. of Maryland, College Park)